Culture and Religion
A world view where the guide for society is based on human nature,
not on ancient scriptures. Home or Topic Groups
Northeastern USA Temperature Modifications
The other web pages in this set (for the Religion of CAGW) involve a presentation of the temperatures in the 'raw' data set at GISS. There are three data sets at GISS: for raw data (with some corrections), combined data (after combining multiple records for the same location) and homogenized data (after a 'cleaning' adjustment). This web page shows the calculated difference between the raw values and the homogenized values, presented as the annual average (averaging the difference for all the months in each year having a temperature record). These charts use Jan-Dec for the months in each year. Since GISS performs seasonal averaging, with the seasons beginning in December not January, the charts sometimes show a slight change in the last year before a step change; this slight difference is due to the GISS adjustment for the next step starting in December.
There are three possible trends to observe:
If the line of the temperature differences is flat on zero then that means there were no adjustments by GISS between the raw temperatures and the homogenized temperatures.
If the trend of the line is from the upper left (positive) toward zero at the right then that means there must have been warming due to the location of the temperature measurement instrument(s), presumably due to the urban heat island effect (human activities around the instruments warmed the device(s) more than had the device(s) been located away from those activities) and so the oldest temperatures are warmed to compensate for that effect. This adjustment is clear recognition that the temperature record is corrupted (warmed) by the temperature recording methods.
If the trend of the line is from the lower left (negative) toward zero (or positive) at the right then the oldest temperatures were made cooler making any temperature trend in the homogenized data set at this location warmer than the raw temperatures indicated. This adjustment either increases any warming present or results in a warming trend where none was present.
Here are the differences between the annual average temperatures in the raw and homogenized GISS data sets for these states.
The following graphs are for the states in the Northeast region, by their names in alphabetical order like this:
CT,DE,ME,MD,MA,NH,NJ,NY,PA,RI,VT,VA,WV
After each graph is a short summary of the analysis for its locations. The left column of numbers has the temperature adjustments and the right column of numbers are the 10-year averages (of anomalies) for the year at the left. The First Adj is the first adjustment in the record. The First Ave is the first 10-year average in the record. A Peak Ave is a peak (high or low) in the anomaly average while Mid Adj is a middle peak (high or low) in the annual temperature adjustment (a Mid Adj is somewhat uncommon since the typical adjustment starts either high or low and approaches zero at the end). When the adjustments are positive, the oldest raw temperatures have been increased which would be a compensation for when the most recent temperatures are too warm due to the urban heat island effect. When the adjustments are negative, the oldest raw temperatures have been decreased which would make any overall warming trend more severe or could make an overall flat or cooling trend into a warming trend. Take note of the sign of the adjustments and the temperature swings in the first half of the 20th Century.
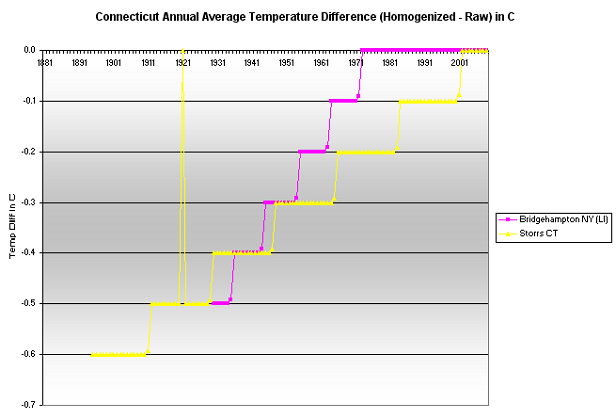
Connecticut
CT/LI Bridgehampton
1930 First Adj -0.5
1939 First Ave -0.4 10-yr Ave -0.4
1943 Peak Ave -0.4 10-yr Ave -0.6
1958 Peak Ave -0.2 10-yr Ave +0.2
1967 Peak Ave -0.1 10-yr Ave -0.6
2009 Last Adj _0.0 10-yr Ave +0.7
CT Storrs
1895 First Adj -0.6
1904 First Ave -0.6 10-yr Ave -0.9
1926 Peak Ave -0.5 10-yr Ave -0.8
1954 Peak Ave -0.3 10-yr Ave +0.3
1967 Peak Ave -0.2 10-yr Ave -0.1
2009 Last Adj _0.0 10-yr Ave +0.8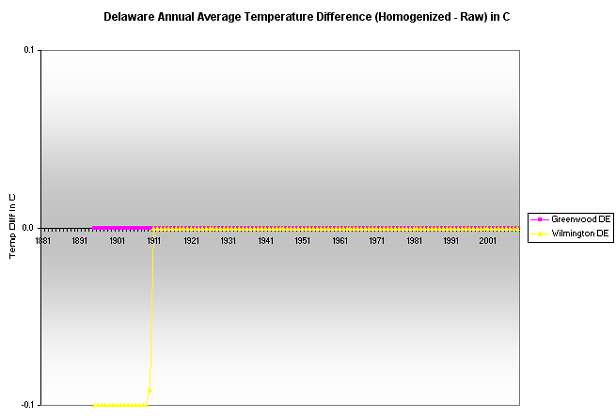
Delaware
DE Greenwood
1895 First Adj 0.0
1904 First Ave 0.0 10-yr Ave -0.4
1954 Peak Ave 0.0 10-yr Ave +0.2
1969 Peak Ave 0.0 10-yr Ave -0.7
2009 Last Adj 0.0 10-yr Ave +1.4
DE Wilmington
1895 First Adj -0.1
1904 First Ave -0.1 10-yr Ave -0.6
1957 Peak Ave _0.0 10-yr Ave +0.4
1970 Peak Ave _0.0 10-yr Ave -0.3
2009 Last Adj _0.0 10-yr Ave +0.3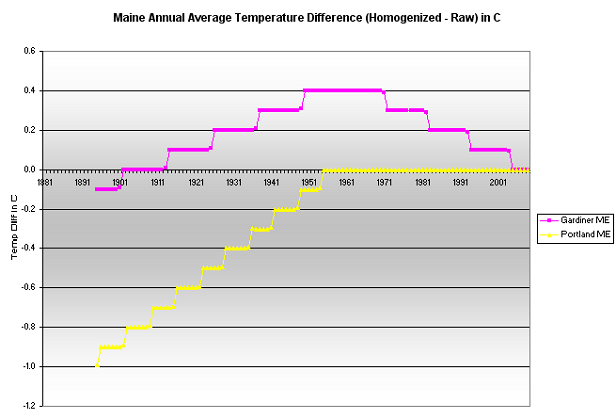
Maine
ME Gardiner
1895 First Adj -1.0
1904 First Ave _0.0 10-yr Ave -0.5
1958 Peak Ave +0.4 10-yr Ave +0.6
1972 Peak Ave +0.3 10-yr Ave -0.1
2009 Last Adj _0.0 10-yr Ave +0.4
ME Portland
1895 First Adj -1.0
1904 First Ave -0.8 10-yr Ave -0.9
1957 Peak Ave _0.0 10-yr Ave +0.7
1972 Peak Ave _0.0 10-yr Ave -0.2
2009 Last Adj _0.0 10-yr Ave +0.9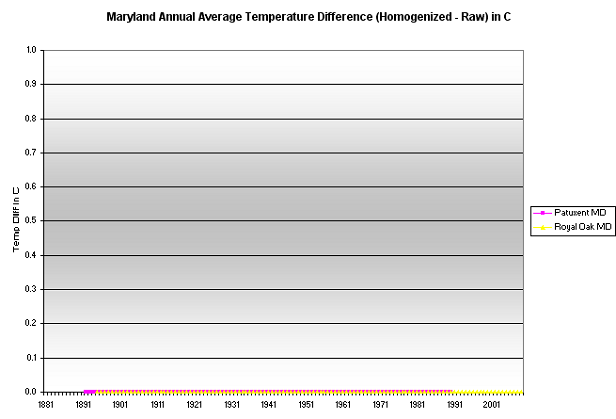
Maryland
MD Patuxent
1892 First Adj 0.0
1901 First Ave 0.0 10-yr Ave -0.2
1910 Peak Ave 0.0 10-yr Ave -0.8
1955 Peak Ave 0.0 10-yr Ave +0.8
1990 Last Adj 0.0 10-yr Ave -0.2
MD Royal Oak
1895 First Adj 0.0
1904 First Ave 0.0 10-yr Ave -0.7
1957 Peak Ave 0.0 10-yr Ave +0.6
1969 Last Adj 0.0 10-yr Ave -0.2
2009 Last Adj 0.0 10-yr Ave +0.8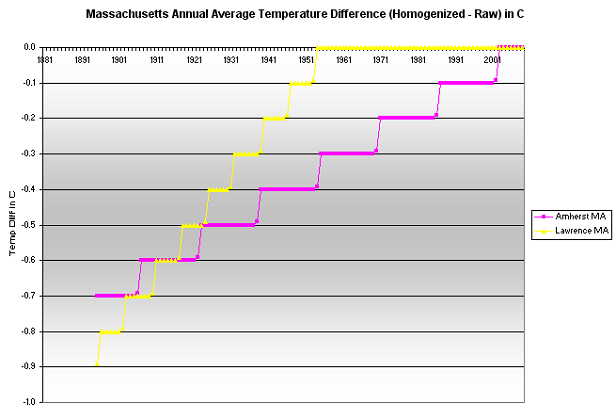
Massachusetts
MA Amherst
1895 First Adj -0.7
1904 First Ave -0.7 10-yr Ave -1.0
1957 Peak Ave -0.3 10-yr Ave +0.8
1967 Peak Ave -0.3 10-yr Ave -0.6
2009 Last Adj _0.0 10-yr Ave +0.8
MA Lawrence
1895 First Adj -0.9
1904 First Ave -0.7 10-yr Ave -0.9
1955 Peak Ave _0.0 10-yr Ave +0.7
1972 Peak Ave _0.0 10-yr Ave -0.1
2009 Last Adj _0.0 10-yr Ave +1.0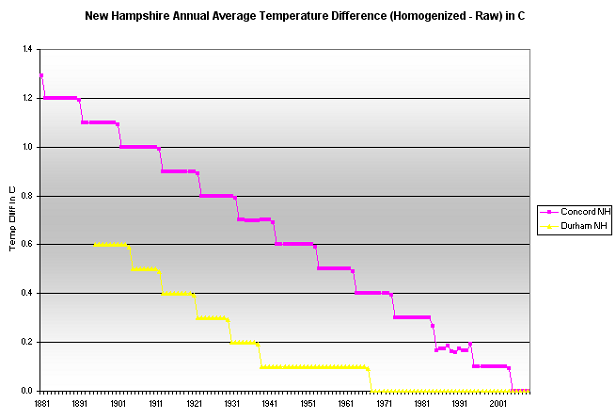
New Hampshire
NH Concord
1881 First Adj +1.3
1890 First Ave +1.2 10-yr Ave +0.2
1908 Peak Ave +1.0 10-yr Ave -0.5
1939 Peak Ave +0.7 10-yr Ave +0.5
1978 Peak Ave +0.3 10-yr Ave -0.7
2009 Last Adj _0.0 10-yr Ave +0.3
NH Durham
1895 First Adj +0.6
1904 First Ave +0.6 10-yr Ave -0.1
1915 Peak Ave +0.4 10-yr Ave +0.1
1948 Peak Ave +0.1 10-yr Ave -0.4
1955 Peak Ave +0.1 10-yr Ave +0.2
1971 Peak Ave _0.0 10-yr Ave -0.4
2009 Last Adj _0.0 10-yr Ave +0.4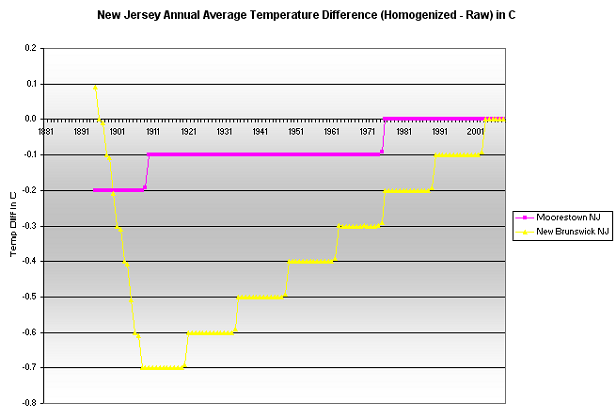
New Jersey
NJ Moorestown
1895 First Adj -0.2
1904 First Ave -0.2 10-yr Ave -0.3
1910 Peak Ave -0.1 10-yr Ave -0.7
1957 Peak Ave -0.1 10-yr Ave +0.3
1969 Peak Ave -0.1 10-yr Ave -0.4
2009 Last Adj _0.0 10-yr Ave +0.7
NJ New Brunswick
1895 First Adj +0.1
1904 First Ave -0.4 10-yr Ave -0.2
1912 Peak Ave -0.7 10-yr Ave -0.8
1957 Peak Ave -0.4 10-yr Ave +0.4
1971 Peak Ave -0.3 10-yr Ave -0.3
2009 Last Adj _0.0 10-yr Ave +1.0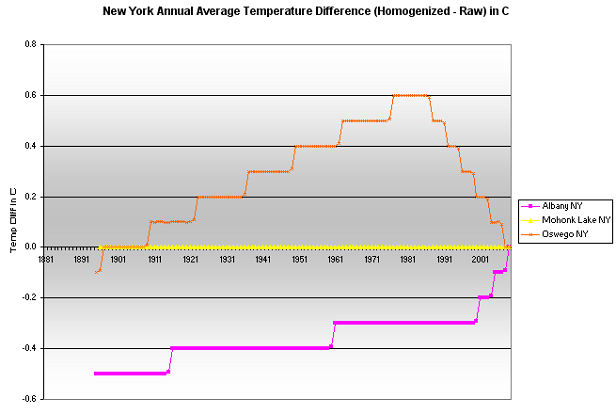
New York
NY Albany
1895 First Adj -0.5
1904 First Ave -0.5 10-yr Ave -0.4
1955 Peak Ave -0.4 10-yr Ave +0.5
1983 Peak Ave -0.3 10-yr Ave -0.2
2009 Last Adj _0.0 10-yr Ave +0.9
NY Mohonk Lake
1895 First Adj 0.0
1904 First Ave 0.0 10-yr Ave -0.6
1955 Peak Ave 0.0 10-yr Ave +0.5
1972 Peak Ave 0.0 10-yr Ave -0.3
2009 Last Adj 0.0 10-yr Ave +0.9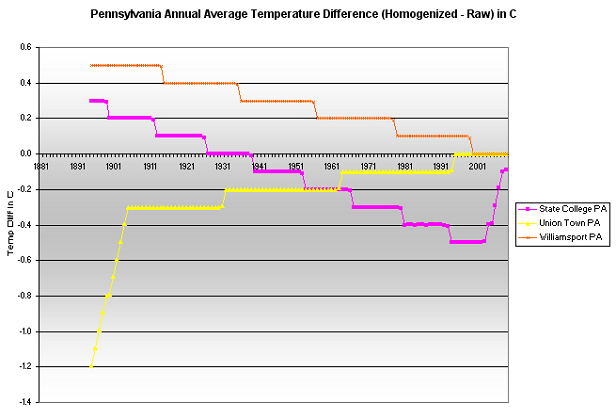
Pennsylvania
PA State College
1895 First Adj +0.3
1904 First Ave +0.2 10-yr Ave +0.1
1910 Peak Ave +0.2 10-yr Ave -0.4
1939 Peak Ave _0.0 10-yr Ave +0.6
1997 Peak Ave -0.5 10-yr Ave -0.6
2009 Last Adj _0.0 10-yr Ave +0.3
PA Union Town
1895 First Adj -1.2
1904 First Ave -0.4 10-yr Ave -0.7
1955 Peak Ave -0.2 10-yr Ave +0.5
1969 Peak Ave -0.1 10-yr Ave -0.5
2009 Last Adj _0.0 10-yr Ave +0.7
PA Williamsport
1895 First Adj +0.5
1904 First Ave +0.5 10-yr Ave _0.0
1910 Peak Ave +0.5 10-yr Ave -0.3
1955 Peak Ave +0.3 10-yr Ave +0.3
1969 Peak Ave +0.2 10-yr Ave -0.5
2009 Last Adj _0.0 10-yr Ave +0.5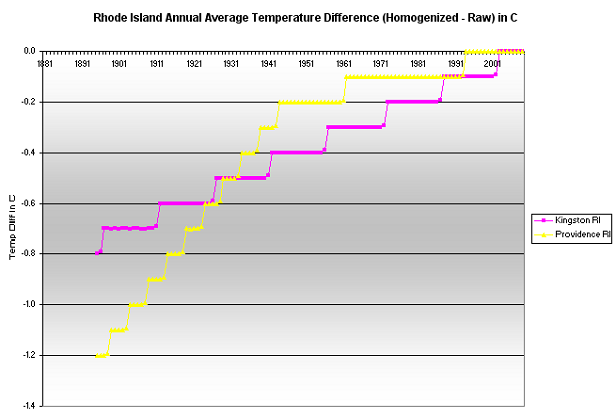
Rhode Island
RI Kingston
1895 First Adj -0.8
1904 First Ave -0.7 10-yr Ave -0.9
1957 Peak Ave -0.3 10-yr Ave +0.5
1969 Peak Ave -0.3 10-yr Ave -0.3
2009 Last Adj _0.0 10-yr Ave +0.9
RI Providence
1895 First Adj -1.2
1904 First Ave -1.0 10-yr Ave -1.1
1953 Peak Ave -0.2 10-yr Ave +0.6
1970 Peak Ave -0.1 10-yr Ave -0.2
2009 Last Adj _0.0 10-yr Ave +1.0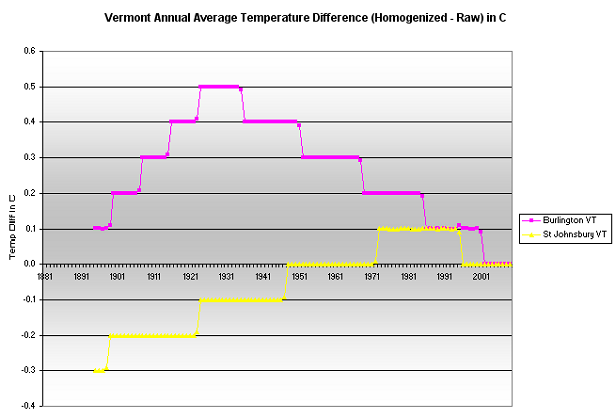
Vermont
VT Burlington
1895 First Adj +0.1
1904 First Ave +0.4 10-yr Ave -0.3
1924 Mid Adj +0.5 10-yr Ave -0.2
1955 Peak Ave +0.3 10-yr Ave +0.6
1972 Peak Ave +0.2 10-yr Ave -0.5
2009 Last Adj _0.0 10-yr Ave +0.5
VT St Johnsbury
1895 First Adj -0.3
1904 First Ave -0.2 10-yr Ave -0.4
1909 Peak Ave -0.2 10-yr Ave -0.7
1955 Peak Ave _0.0 10-yr Ave +0.5
1972 Peak Ave _0.0 10-yr Ave -0.3
2009 Last Adj _0.0 10-yr Ave +0.7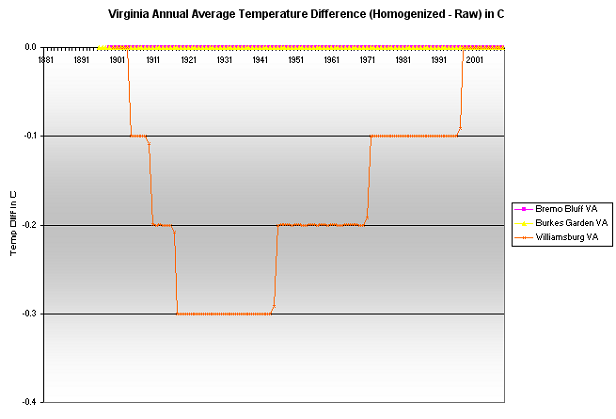
Virginia
VA Bremo Bluff
1899 First Adj 0.0
1908 First Ave 0.0 10-yr Ave -0.3
1957 Peak Ave 0.0 10-yr Ave +0.2
1969 Peak Ave 0.0 10-yr Ave -0.6
2009 Last Adj 0.0 10-yr Ave +0.8
VA Burkes Garden
1896 First Adj 0.0
1905 First Ave 0.0 10-yr Ave +0.3
1910 Peak Ave 0.0 10-yr Ave -0.3
1939 Peak Ave 0.0 10-yr Ave +0.2
1969 Peak Ave 0.0 10-yr Ave -0.9
2009 Last Adj 0.0 10-yr Ave +0.5
VA Williamsburg
1900 First Adj 0.0
1909 First Ave -0.1 10-yr Ave -0.4
1918 Mid Adj -0.3 10-yr Ave -0.2
1954 Peak Ave -0.2 10-yr Ave +0.4
1969 Peak Ave -0.2 10-yr Ave -0.5
2009 Last Adj _0.0 10-yr Ave +0.6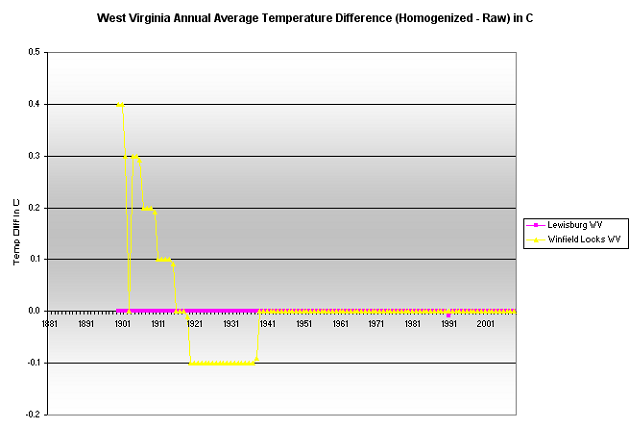
West Virginia
WV Lewisburg
1900 First Adj 0.0
1909 First Ave 0.0 10-yr Ave -0.1
1939 Peak Ave 0.0 10-yr Ave +0.7
1969 Peak Ave 0.0 10-yr Ave -0.6
2009 Last Adj 0.0 10-yr Ave +0.4
WV Winfield Locks
1900 First Adj +0.4
1909 First Ave +0.2 10-yr Ave _0.0
1924 Peak Ave -0.1 10-yr Ave -0.4
1947 Peak Ave _0.0 10-yr Ave +0.4
1969 Peak Ave _0.0 10-yr Ave -0.7
2009 Last Adj _0.0 10-yr Ave +0.4
There is a mix of locations adjusted for warming (to reduce the warming trend in the raw data set) and for cooling (to increase the warming trend in the raw data set).
Here is an analysis of the temperature record.
created - Jan. 2011
last change - 02/03/2011
Here is the list of topics in this AGW Topic Group .
All Topic Groups are available by selecting More TG.
All topics in the site are in the Site Map, where each Topic Group has its topics indented below it.
Ctrl + for zoom in; Ctrl - for zoom out ; Ctrl 0 for no zoom;
triple-tap for zoom to fit; pinch for zoom change; pinched for no zoom