Culture and Religion
A world view where the guide for society is based on human nature,
not on ancient scriptures. Home or Topic Groups
Temperature Modifications in the GISS Data Set
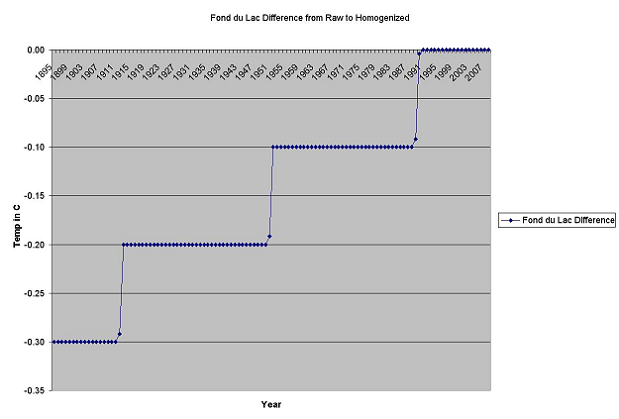
The other web pages in this set (for the Religion of CAGW) involve a presentation of the temperatures in the 'raw' data set at GISS. There are three data sets at GISS: for raw data (with some corrections), combined data (after combining multiple records for the same location) and homogenized data (after a 'cleaning' adjustment). This web page shows the calculated difference between the raw values and the homogenized values, presented as the annual average (averaging the difference for all the months in each year having a temperature record). These charts use Jan-Dec for the months in each year. Since GISS performs seasonal averaging, with the seasons beginning in December not January, the charts sometimes show a slight change in the last year before a step change; this slight difference is due to the GISS adjustment for the next step starting in December.
There are three possible trends to observe:
If the line of the temperature differences is flat on zero then that means there were no adjustments by GISS between the raw temperatures and the homogenized temperatures.
If the trend of the line is from the upper left (positive) toward zero at the right then that means there must have been warming due to the location of the temperature measurement instrument(s), presumably due to the urban heat island effect (human activities around the instruments warmed the device(s) more than had the device(s) been located away from those activities) and so the oldest temperatures are warmed to compensate for that effect. This adjustment is clear recognition that the temperature record is corrupted (warmed) by the temperature recording methods.
If the trend of the line is from the lower left (negative) toward zero (or positive) at the right then the oldest temperatures were made cooler making any temperature trend in the homogenized data set at this location warmer than the raw temperatures indicated. This adjustment either increases any warming present or results in a warming trend where none was present.
There are four regions of USA for this analysis:
Midwest There are 13 states in this region.
NortheastThere are 12 states in this region.
SoutheastThere are 12 states in this region.
WestThere are 13 states in this region.
WorldThere are 16 regions in the world (excluding USA).
The following is an example from the local site.
Note: this analysis just compares the raw to homogenized data sets. It does not analyze the validity of the temperatures recorded. There have been reports on that situation including one from surfacestations.org titled: Is the US Surface Temperature Record Reliable?.
Here is another analysis of the temperature record.
created - Jan. 2011
last change - 01/15/2011
Here is the list of topics in this AGW Topic Group .
All Topic Groups are available by selecting More TG.
All topics in the site are in the Site Map, where each Topic Group has its topics indented below it.
Ctrl + for zoom in; Ctrl - for zoom out ; Ctrl 0 for no zoom;
triple-tap for zoom to fit; pinch for zoom change; pinched for no zoom